

To give you an image of how often Bitcoin’s intraday price is out of whack, I’ve pieced together this simple Javascript tool that annotates every 1-minute candle that’s longer than 5 standard deviations, or “sigmas”. It’s a small follow-up to my last piece, “Price Moves Show Bitcoin Is A Penny Stock“. It’s dynamic, too, so […]
Tag Archives: penny stock
Price Moves Show Bitcoin Is A Penny Stock
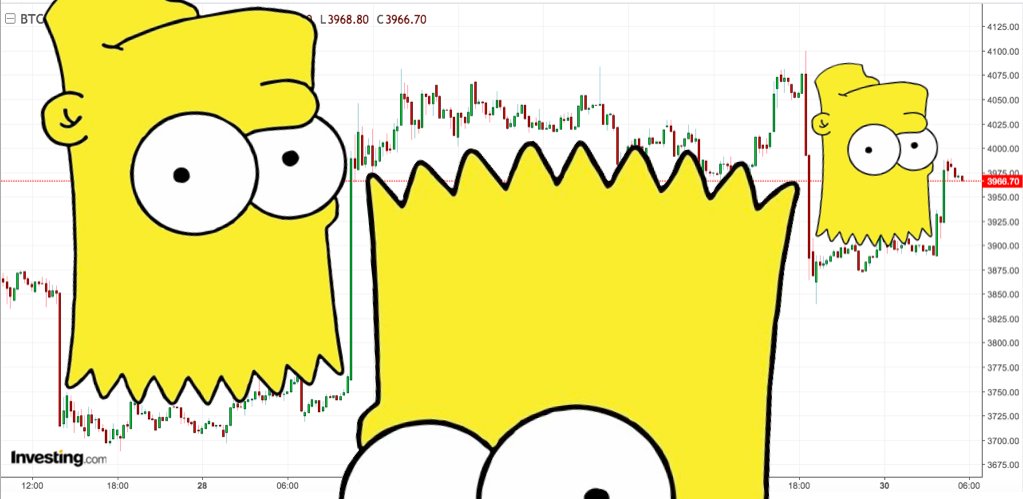
“The Bart” is a commonly known pattern in Bitcoin charts, to the point of having become a meme on Twitter and reddit. It’s a figure formed by sudden moves in Bitcoin price, followed by period of relative calm. “The Bart” has become a joke among Bitcoin critics, who point to the Bart as evidence that […]