
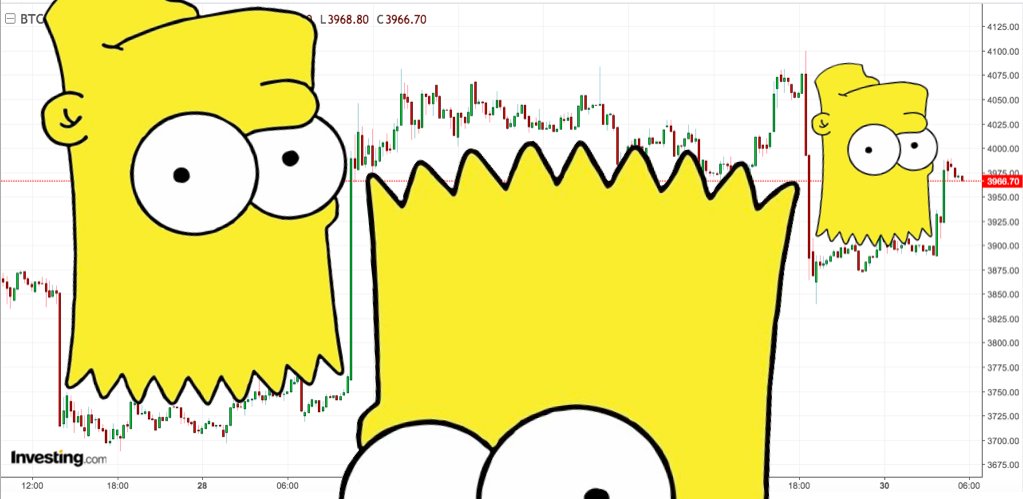
“The Bart” is a commonly known pattern in Bitcoin charts, to the point of having become a meme on Twitter and reddit. It’s a figure formed by sudden moves in Bitcoin price, followed by period of relative calm.
“The Bart” has become a joke among Bitcoin critics, who point to the Bart as evidence that crypto exchanges manipulate prices to burn margin traders. To see if that’s true, I’ve performed a statistical analysis of Bitcoin candlestick distribution, and compared it to that of a blue-chip stock: IBM.
My conclusion? Bitcoin price moves appear out of whack because all the liquidity is fake. Bitcoin is in reality a penny stock, with 2% bid-ask spreads.
Measuring the outstanding nature of Bitcoin price moves
For some context, David Gerard, author of the “Attack Of The 50 Foot Blockchain”, dedicated a whole post to The “Bart” — sudden hundreds-of-Bitcoin pumps or dumps, to burn the margin traders.
Bitcoin critics point to these pumps and dumps as evidence that the Bitcoin price is manipulated. Supposedly, nefarious actors manufacture sudden spikes in Bitcoin’s price, forcing liquidations. They then use these liquidations to close their positions which they had opened to manufacture the spike, raking in seemingly risk-free profits to the detriment of crypto day-traders.
Bitcoin proponents, on the other hand, claim that sudden moves happen in regulated markets, too, and this “circumstantial evidence” is just wild speculation. Indeed, anyone who has followed Elon Musk’s antics on Twitter in September-October 2018 has seen a few Barts forming in Tesla’s stock price, too.
What could be expected from random price moves
Markets are subject to volatility - daily volatility, and intraday volatility. It is perfectly natural for prices to move around without any apparent reason. However, one is entitled to expect prices to move according to certain rules - namely, that price moves taken as a whole should fall within the bounds of certain norms.
One of these norms is aptly called the “normal distribution“:
The more volatile the markets, the wider the Bell curve - shaped distribution above becomes, but it keeps its general shape.
Now, everyone knows that even though the normal distribution is appealing in its mathematical elegance for purposes of computation, real markets have more curves than that; namely, “rare events” happen much more frequently than a normal distribution would allow us to expect. That’s why these events are called “fat tail events” - because the tails of the distribution should be fatter than those of a perfect Bell curve.
What is a “fat tail” event
Price volatility is most commonly measured in terms of standard deviation - which is basically a measure of the average amplitude of one price candle on a chart. The standard deviation depends on the time horizon, of course: the standard deviation of one-minute candles is naturally lower than the standard deviation of one-hour candles.
The normal distribution states that 95% of all candles should fall within approximately 2 standard deviations from zero, meaning that only 1 in 20 candles should be longer than 2 standard deviations. Furthermore, 99.7% of all moves should fall within 3 standard deviations from zero, meaning that only 1 in 300 candles should be longer than 3 standard deviations.
“Fat tail events” are candles that should theoretically almost never happen. Anything above 5 or 6 standard deviations is considered a “fat tail move”. A “7 sigma event” (meaning a candle that’s 7 times longer than the standard deviation), for example, should theoretically happen only once per one billion candles.
How frequent are fat tail events in Bitcoin’s price?
I’ve downloaded all the Coinbase trade database from bitcoincharts.com, computed the data for the last 20 trading days, and observed the distribution characteristics of 5-minute candles:
| Time period | Standard deviation | Most extreme events observed |
| Last 5 days | 0,158 % | 23 standard deviations: 1 event |
| 5 days prior | 0,277 % |
17 standard deviations: 1 event 18 standard deviations: 1 event |
| 5 days prior | 0,279 % |
10 standard deviations: 1 event 12 standard deviations: 1 event |
| 5 days prior | 0,321 % |
7 standard deviations: 1 event 8 standard deviations: 1 event |
Let’s see if you can find the 23-standard-deviations-event on this chart:
To be honest, extreme fat tail events have been proven to occur much more frequently in intraday charts than in daily charts. But a 23 sigma event, even in intraday charts, is weird, to put it mildly.
How dependant are fat tail events on the candle period?
Here’s the distribution characteristics of 1-hour candles:
| Time period | Standard deviation | Most extreme events |
| Last 20 days | 0,92 % |
5 standard deviations: 4 events 6 standard deviations: 2 events |
| Last 100 days | 0,863 % |
7 standard deviations: 2 events 8 standard deviations: 2 events 9 standard deviations: 2 events |
Hourly distributions look much, much more orderly than 5 minute distributions. This trend continues as the candle period rises: for 4-hour candles, there were only one 6-sigma, and three 5-sigma events over the last 100 days; for 12-hours candles, only one 5-sigma event.
The 1-minute candle distribution, one the other hand, is completely out of whack, with nine over - 20 sigma events over the last 100 days.
How do Bitcoin price moves compare with regulated markets?
I’ve downloaded the trading data for IBM from kibot.com (free intraday data for stocks or indices is notoriously hard do find). I ran into troubles from the very start.
Pre-market trading, after-hours trading, nights and weekends
I had to exclude all trading before 10 am, and all trading after 3:58 pm, because markets get jittery around the opening and closing bells as liquidity evaporates, and trading data gets otherwise polluted by settlement trades. In thus doing, I excluded all overnight price moves, which is a huge bias. For instance, this excluded the earnings miss of October 16th, 2018, when IBM’s stock price moved by 6% over a couple of minutes in after-hours trading. Remember this one, as I’ll come back to it later on.
How frequent were fat tail events in IBM’s price?
Over the last 100 days, only taking trading between 10 am and 3:58 pm, IBM’s 5 minute candles exhibit two 6 sigma events, and two 5 sigma events; 1 minute candles exhibit two 9 sigma events, one 8 sigma event, and one 7 sigma event.
The data seems to indicate that Bitcoin’s price moves in ways that couldn’t occur naturally, even if we account for the fact that intraday candle distributions have fatter tails, as is shown by 1-minute candle distributions:
| Bitcoin | IBM |
|
28 sigma: 1 event 23 sigma: 2 events 22 sigma: 1 event 21 sigma: 3 events 20 sigma: 2 events |
9 sigma: 1 event 8 sigma: 1 event 7 sigma: 1 event |
Remember that a 20 sigma event is supposed to be millions of billions of times less likely to occur than a 9 sigma event!
What about after-hours events?
Remember the earnings miss of October 16th, 2018, when IBM’s stock price moved by 6% over a couple of minutes in after-hours trading? That was a freaking 40 sigma event. The probability of that happening is 0.0000000000000000000000000000000000000000000000000000001%, and I left out a few dozens of zeroes. So what went wrong here, and what does it mean?
What could explain Bitcoin’s extreme price moves?
IBM’s stock plunged by 40 times the average 5-minute candle because of an exogenous event: the company released its earnings, and they were crap. Asset prices move on news, or at least they are supposed to. Could that explain Bitcoin’s extreme intraday price moves?
There are no universally agreed-upon events that could move Bitcoin’s price
For a piece of news to move an asset’s price over a couple of minutes, a lot of people must expect that piece of news, and also expect that it will move Bitcoin’s price.
The only such event I can remember is the rejection of the SegWit2x hard fork in late 2017, and the Bitcoin price did move around violently, but how about the regular spikes we see almost on a daily basis? You can check for “extreme moves” on my Bitcoin Extreme Move Intraday Tracker, where all the 7-sigma moves are annotated on a one-minute price chart, for the last 24 hours.
What if the Bitcoin market is manipulated, but not in the way you think?
What I found outstanding in my analysis - and that’s something you can see for yourself simply by zooming out the Bitcoin chart - is that hourly Bitcoin candles are perfectly well distributed. There are no extreme events, it all looks orderly and normal.
Another asset class has the same characteristic: penny stocks. These are deeply illiquid, thinly traded securities where anyone with a few thousand dollars to spare can move prices at a whim.
Bitcoin proponents will mock the comparison, because we’re relentlessly told that Bitcoin trading volumes are in the billions per day, but is it true? Major Bitcoin exchanges are routinely accused to fake volume, and without proper supervision and oversight, it’s very probable that they do.
Bitcoin is a penny stock
I don’t believe that Bitcoin’s extreme price moves are pumps and dumps devised to screw margin traders, simply because all these margin traders would be cleaned out by now.
I believe, however, that manipulation happens between these pumps and dumps, when markets appear orderly. In reality, there are no real trades then - only fake bot activity to make it look like something is happening.
It’s these periods in-between pumps and dumps that distort the candle distribution, by producing candles that shouldn’t exist.
Bitcoin is a penny stock with bid/ask spreads to the tune of 2 to 3 per cent of its price. Any time someone comes in with a real order, the price pumps (or dumps) to the offer (or bid).
Don’t get fooled by randomness, because there is none.
Finally… someone smart enough to explain the obvious.